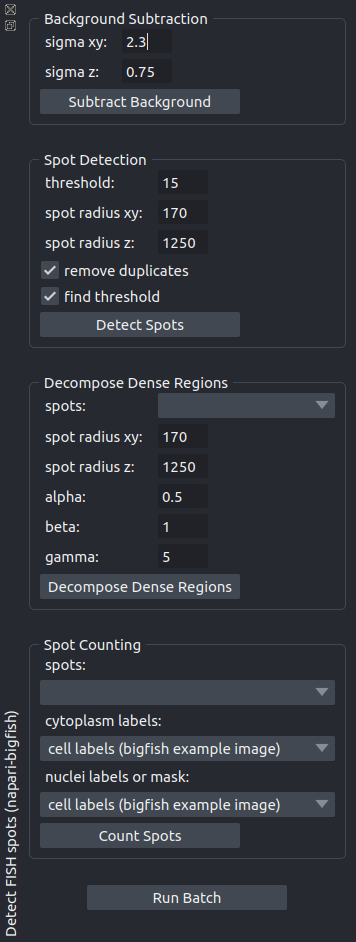
The napari-bigfish plugin
Start napari and run Detect FISH spots (napari-bigfish) from the menu Plugins. Open the image containing the FISH-spots. If you also want to count spots per cell and per category nucleus/cytoplasm, open an image with the cell labels and one with the nuclei mask or labels.
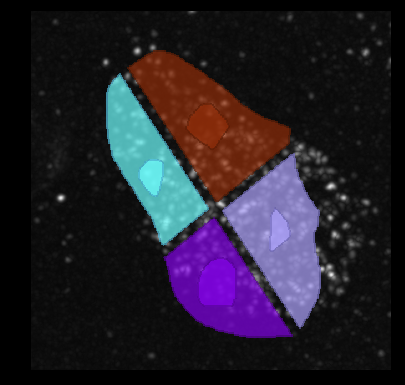
The plugin comes with an example image that you can open via File>Open Sample>BigFISH smFISH Analysis (napari-bigfish). This is a synthetic image that contains the FISH-Spots in the background and in 4 “cells” each one with one “nucleus”.
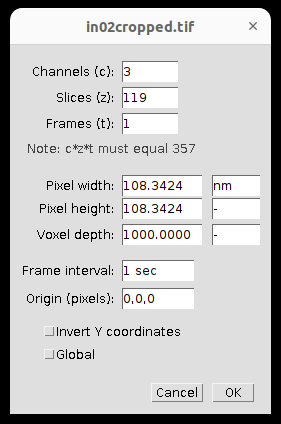
When using your own images, make sure that the scale in the image (pixel size in x, y and z) is correctly set. The plugin requires the scale to be in nanometers (nm). If you use the naparj-j plugin to transfer images from FIJI/ImageJ to napari, you can set the scale in the properties dialog available via Image>Properties....
In napari you can check and modify the scale attribute of a layer from the integrated IPython console:
In [1]: viewer.layers.selection.active.scale
Out[1]: array([1000.    ,  108.3424,  108.3424])
Background Subtraction
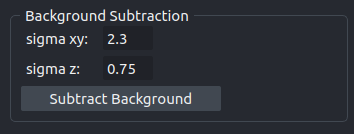
The operation removes the background by subtracting a blurred version of the image from the original image. A new image layer with the result image will be created.
- sigma xy
The standard deviation of the Gaussian kernel in the xy-plane.
- sigma z
The standard deviation of the Gaussian kernel in the z-dimension.
- See also:
Spot Detection
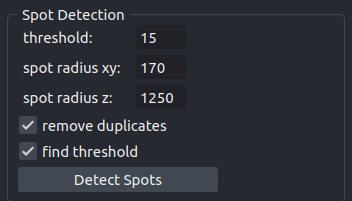
The operation uses a LoG-filter and a local maximum detection to detect spots. A new points-layer containing the detected spots will be added to the viewer.
- threshold
The local threshold used for the spot detection. If
find thresholdis selected, this value will be ignored and the auto-detected threshold value will be used instead. The field will be updated with the detected threshold value.- spot radius xy
The radius of a spot in the xy-plane in nanometer.
- spot radius z
The radius of a spot in the z-dimension in nanometer.
- remove duplicates
Remove potential duplicate coordinates for the same spots. The option slows the execution.
- find threshold
If selected the threshold is automatically detected, otherwise the value from the threshold-field is used.
- See also:
Decompose Dense Regions
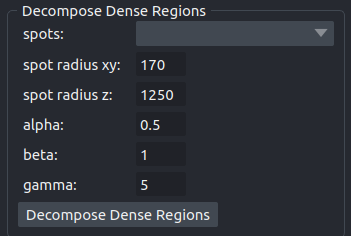
The operation breaks up clustered regions by building a reference spot and fitting it as many times as possible into the region. A new points-layer with the resulting spots will be added to the viewer.
- spots
The points layer of the spots from a previous detection to which the decomposition shall be applied.
- spot radius xy
The radius of a spot in the xy-plane in nanometer.
- spot radius z
The radius of a spot in the z-dimension in nanometer.
- alpha
Intensity percentile used to compute the reference spot, between 0 and 1. The higher, the brighter are the spots simulated in the dense regions. Consequently, a high intensity score reduces the number of spots added. Default is 0.5, meaning the reference spot considered is the median spot.
- beta
Multiplicative factor for the intensity threshold of a dense region. Default is 1.
- gamma
Multiplicative factor used to set the gaussian kernel size, for a gaussian background removal. A large gamma increases the scale of the gaussian filter and smooth the estimated background. To decompose very large bright areas, a larger gamma should be set.
- See also:
Spot Counting
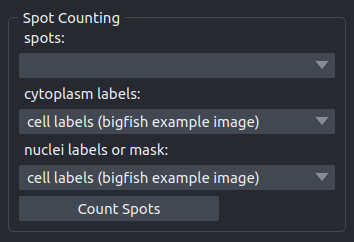
Counts the spots in the image. If a label image for cells is given the spots are counted per cell. If in addition a label image or a binary mask of the nuclei is given the spots within the cytoplasm and the nuclei are counted separately per cell. A table containing the results will be opened in the viewer. The results from the table can be exported to a spreadsheet program using copy and paste.
- spots
The previously detected spots in the form of a points-layer.
- cytoplasm labels
A labels layer with labels of the cells. The background should have the label 0.
- nuclei labels of mask
A labels layer in which the background has the label 0 and voxels belonging to a nucleus have a value bigger than 0.
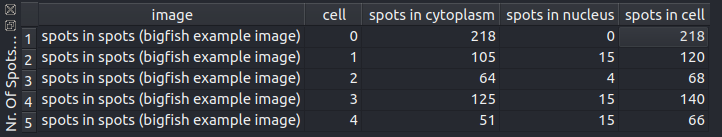
To select the whole table click into the upper-left corner of the table. To copy the selected data use either ctrl+c or the contex-menu of the table.