 |
 |
 |
|---|---|---|
| Ex 5.2: Use StarDist in QuPath | • | Ex 5.4: Use CellPose in QuPath |
5. Cells detection
5.3 Segmentation quality control
So far, a better or worse result was determined through eyeballing. As reliable as an expert's eye can be, we would prefer to have numbers describing how good a segmentation is, and possibly its strengths and its weaknesses (more false negative, more false positives, ...).
5.3.1 Compare BuiltIn vs GT and StarDist vs GT
Goals:
- We want to compare both methods from previous exercises on the exact same images:
- QuPath built-in detection (
BuiltIn) - StarDist detection (
StarDist)
- QuPath built-in detection (
- For each method, we will compare predictions against reference nuclei (
GT). - We will compute image-level metrics:
IoUDicePrecisionRecallTP_Count,FP_Count,FN_Count(number of nuclei, one-to-one matching)OverSeg_GT_Count,UnderSeg_Pred_Count(sur/under-segmentation diagnostics)
- Then we will decide which method is better for this dataset.
Required data:
| Folder | Description | Location | License |
|---|---|---|---|
| NuInsSeg | H&E images of mouse spleen + polygon files (polygons/*.json) used as GT |
Kaggle: NuInsSeg | CC-BY-4.0 |
Note
For a fair comparison, keep exactly the same selected images for both evaluations.
A. Prepare two separated evaluation projects
- Keep two distinct projects:
- In both projects, keep exactly the same image list for fair comparison.
- In each project, import GT nuclei using unpack-detections.groovy:
- Run once on one image to verify.
- Then run for project using
 "more options".
 - If the imported class name is not
GT, adaptgt_classin the scripts below to the imported class name. - In
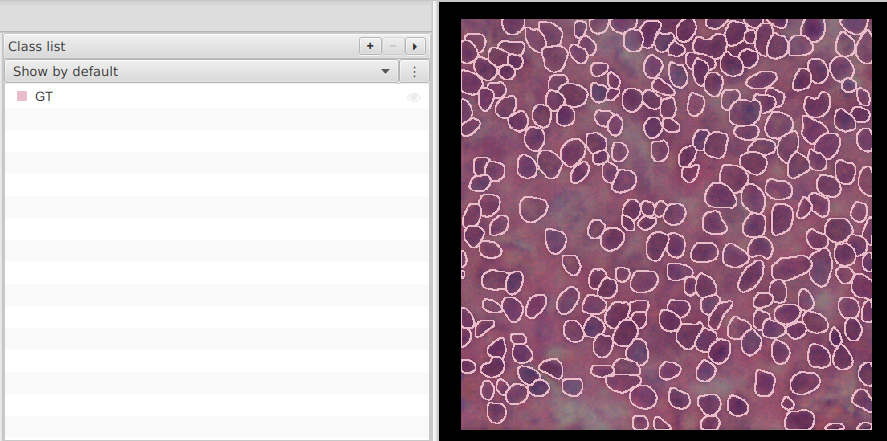
Class list, create/set theGTclass now so you can toggle GT visibility during QC.
- Save both projects.
Warning
Prefer a clean copy of each project for this exercise. If you reuse an older project, remove old test annotations/detections and old SegQC measurements first.
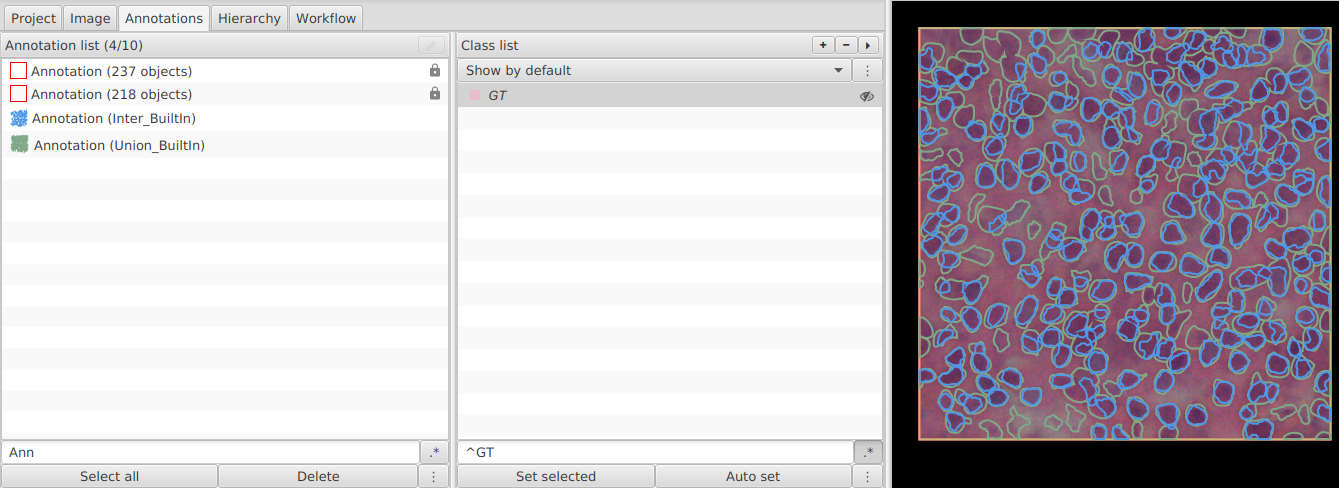
B. In Project_BuiltIn: create Inter_* and Union_*
a. One image
- Open build-intersection-union.groovy.
- Set class names for the first comparison:
def gt_class = "GT"
def pred_class = "BuiltIn"
def inter_class = "Inter_BuiltIn"
def union_class = "Union_BuiltIn"
- Run on one image and check that both output annotations were created.
b. Whole project
- Run the same script for project using "more options".
- Save
Project_BuiltIn.
C. In Project_BuiltIn: compute metrics
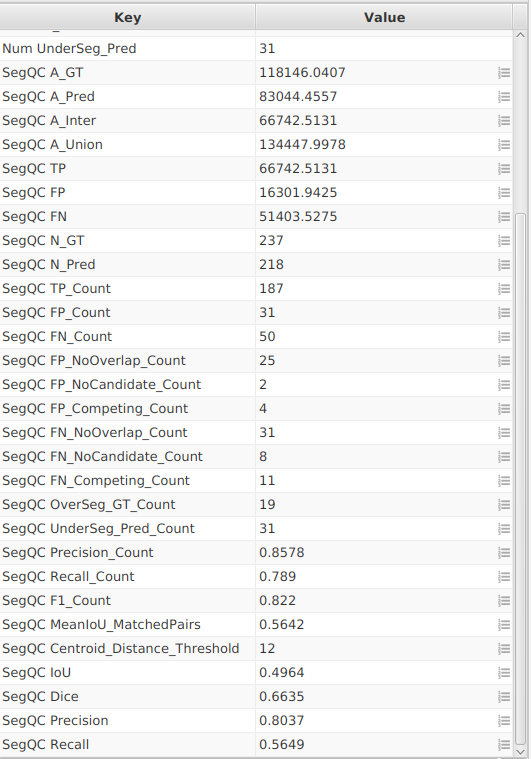
- Open compute-segmentation-metrics-counts.groovy.
- Set:
def gt_class = "GT"
def pred_class = "BuiltIn"
def inter_class = "Inter_BuiltIn"
def union_class = "Union_BuiltIn"
def measurement_prefix = "SegQC BuiltIn "
def centroid_distance_threshold = 12.0
- In
Class list, create/set theBuiltInclass now so you can toggle prediction visibility during QC. - Run once on one image to verify image-level measurements (
IoU,Dice,Precision,Recall) and count-based metrics (TP_Count,FP_Count,FN_Count,OverSeg_GT_Count,UnderSeg_Pred_Count). - Run for the whole project.
- Save
Project_BuiltIn.
D. In Project_StarDist: repeat the same steps
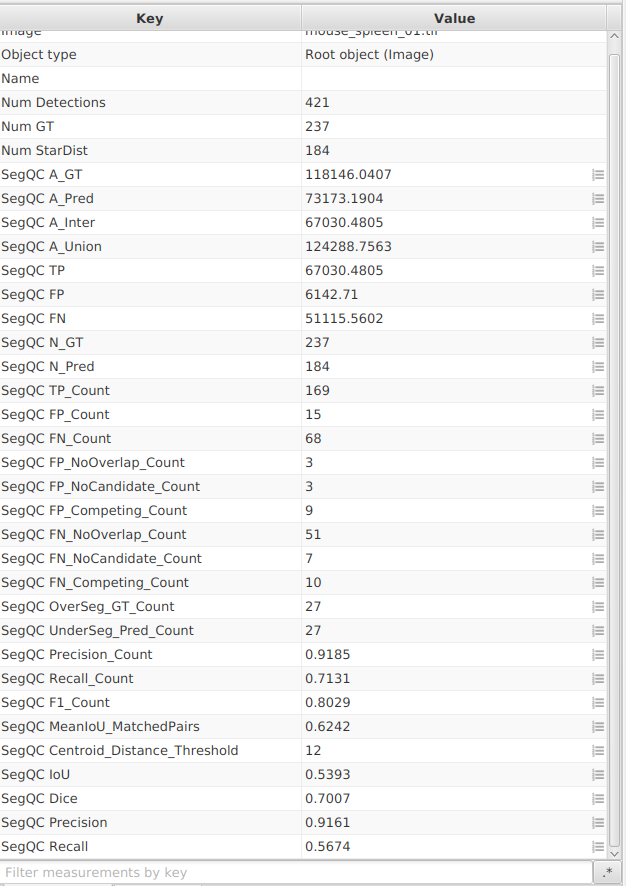
- Re-run build-intersection-union.groovy with:
def gt_class = "GT"
def pred_class = "StarDist"
def inter_class = "Inter_StarDist"
def union_class = "Union_StarDist"
- Re-run compute-segmentation-metrics-counts.groovy with:
def gt_class = "GT"
def pred_class = "StarDist"
def inter_class = "Inter_StarDist"
def union_class = "Union_StarDist"
def measurement_prefix = "SegQC StarDist "
def centroid_distance_threshold = 12.0
- In
Class list, create/set theStarDistclass now so you can toggle prediction visibility during QC. - Run once on one image, then for the whole project.
- Save
Project_StarDist.
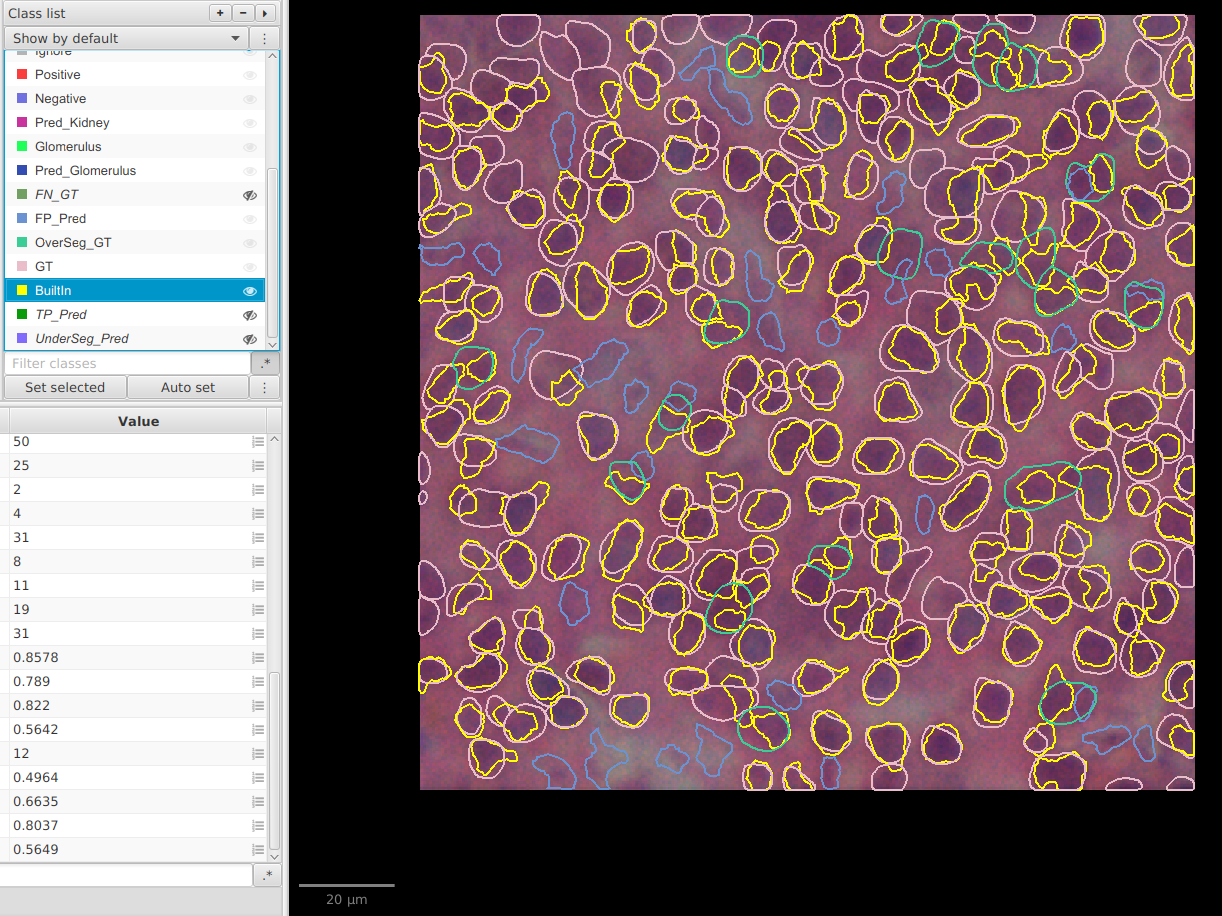
E. Visualize TP / FP / FN on the image
- Open mark-tp-fp-fn-overlays.groovy.
- Run it in each project with matching class names:
def gt_class = "GT"
def pred_class = "BuiltIn" // or "StarDist"
def centroid_distance_threshold = 12.0
- The script creates overlay detections:
TP_PredFP_PredFN_GTOverSeg_GTUnderSeg_Pred
- The script creates a new full-image annotation named
SegQC_OverlayParentand stores overlay detections inside grouped sub-parents (TP_Pred,FP_Pred,FN_GT,OverSeg_GT,UnderSeg_Pred). - It prints counts in the console (
TP,FP,FN,OverSegGT,UnderSegPred) for quick sanity check. - In
Class list, create/set classes for each overlay type as soon as they appear (TP_Pred,FP_Pred,FN_GT,OverSeg_GT,UnderSeg_Pred) so you can show or hide them independently instead of displaying all detections at once. - This gives a direct visual map of over-segmentation (
FP,OverSeg_GT) and under-segmentation (FN,UnderSeg_Pred).
F. How to interpret advanced count metrics
FP_NoOverlap_Count: predicted objects that do not overlap any GT at all (pure hallucinations).FP_NoCandidate_Count: predicted objects that overlap GT but do not satisfy the counting rule (centroid in object or centroid distance threshold).FP_Competing_Count: predicted objects that had a valid candidate but lost in one-to-one assignment.FN_NoOverlap_Count: GT objects with no overlapping prediction at all (completely missed nuclei).FN_NoCandidate_Count: GT objects that overlap predictions but do not satisfy the counting rule.FN_Competing_Count: GT objects that had a valid candidate but lost in one-to-one assignment.OverSeg_GT_Count: number of GT nuclei overlapped by more than one prediction (over-segmentation pattern).UnderSeg_Pred_Count: number of predictions overlapping more than one GT nucleus (under-segmentation pattern).MeanIoU_MatchedPairs: mean IoU computed only on matched TP pairs; useful to judge shape quality among successful detections.Centroid_Distance_Threshold: centroid distance threshold used for centroid-based counting.
Object matching is centroid-based: a pair is valid if the prediction centroid is inside GT, or the GT centroid is inside the prediction, or the centroid distance is below centroid_distance_threshold.
Area metrics (IoU, Dice, Precision, Recall) are still useful to describe mask quality, but they no longer decide TP/FP/FN for counting.
These metrics are diagnostics: they help explain why FP/FN happen, not replace TP_Count/FP_Count/FN_Count.
G. Export both projects and compare methods
- In
Project_BuiltIn: export image measurements tosegqc-builtin.tsv. - In
Project_StarDist: export image measurements tosegqc-stardist.tsv. - Export type:
Imagefor both. - In your spreadsheet, add a new column
Methodto each TSV (BuiltInorStarDist). - Stack the two TSV files vertically into one single table.
- Sort the combined table by
Image, then byMethod, so each image appears twice (BuiltIn, thenStarDist). - Compare methods on the same image set:
- Compare
TP_Count,FP_Count,FN_Countfirst (counting quality). - Use
OverSeg_GT_CountandUnderSeg_Pred_Countto understand if errors come from over- or under-segmentation. - Start with median
IoU(global overlap quality). - Use median
Diceto break ties. - Check
Precision(false positives) andRecall(false negatives) according to your objective.
- Compare
| Priority | Better indicator |
|---|---|
| Balanced segmentation | Highest IoU and Dice |
| Avoid false positives | Highest Precision |
| Avoid missed nuclei | Highest Recall |

Note
If one method wins on IoU/Dice but loses badly on Precision or Recall, document this trade-off explicitly before choosing your final workflow.