 |
 |
|---|---|
| • | Ex 5.2: Use StarDist in QuPath |
5. Cells detection
5.1 QuPath built-in method
QuPath has a simple built-in method to segment nuclei and estimate cells from them.
The method consists in:
- thresholding the nuclei channel (whether it is a true channel or a deconvoluted channel).
- splitting up the mask using the watershed algorithm.
- expanding the polygons while paying attention to collisions to simulate the cytoplasm.
- optionaly, the objects are measured (intensities and shape).
5.1.1 Mean nucleus-to-cytoplasm CD73 intensity
Goals:
- We want to process the nucleus-to-cytoplasm CD73 intensity ratio for each individual cell to eventually have the mean (and stddev) ratio for per image.
- To do so, we will need to:
- Given the DAPI staining, segment the nuclei in the image.
- Estimate the cytoplasm given the nuclei.
- Measure the intensities in both areas.
- Export the measurements and process the mean nucleus-to-cytoplasm CD73 intensity ratio.
Required data:
| Folder | Description | Location | License |
|---|---|---|---|
| CD73_Spleen-10x | Fluo images of spleen where the 3rd channel contains a DAPI staining and the 1st channel contains a CD73 staining. | Courtesy of Tommy CHASTEL and Claire CRAMPES, Andrei TURTOI team, IRCM | - |
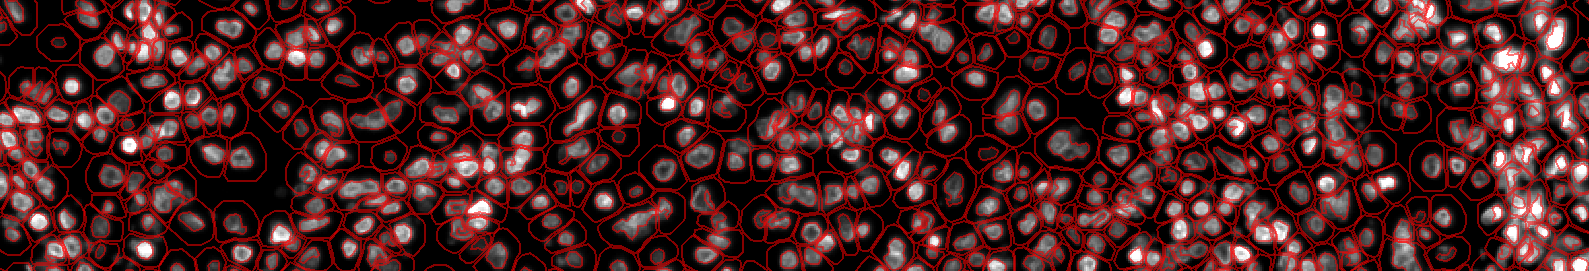
A. Detect cells
- Start by opening the image and hide all the channels except for the nuclei one.
- Even though the built-in method is simple, its execution can take a significant duration. To avoid waisting time, we will tune our settings in a small area.
- You can do that by creating a
 rectangle annotation with a side length approximately ¼ the size of the image.
 - Make sure that you keep this annotation active (drawn in yellow in the viewer) and go to "Analyze" > "Cell detection" > "Cell detection...".
- Set the detection channel to the 3rd one (the nuclei).
- On this image, the nuclei are very small (≈12 pixels in diameter) so we don't want to work on a downsampled version. Set the requested pixel size to the image's original pixel size.
- The
background radiuswill be used by the algorithm that we will choose to perform the background correction. Given the diameter of our objects (≈12 pixels → 7.8µm), the smallest radius that you can use is 3.9µm, but you should increase it a little bit for safety reason (to avoid poking holes in bigger objects). You can put a negative value if you want to deactivate it. - If you check
opening by reconstruction, the background correction algorithm will be the opening by reconstruction, otherwise, it will be the rolling ball. In this case, it doesn't make much difference. - Skip all other settings (we will adjust them later) and go straight to
split by shape. Just make sure that it is activated, we want touching nuclei to be represented as separated objects as much as possible. - Adjust the
cell expansionto something that could make sense biologically (5µm is fine). - Our final goal is to process a ratio of intensities, so make sure that
Make measurementsis checked. - Now will start an iterative process during which you will have to tune your settings.
Warning
Changing a value can (and will very certainly) invalidate a few others, so you won't tune a value just once!
- Iteratively (as many times as you need), you will:
- Run the cell detection.
- If some objects are found in the background: increase the
Thresholdvalue. - If the nuclei polygons make a moon shape around the holes: increase the
Background radiusvalue of the background correction. It is because the background correction pokes holes in your objects. - If two touching nuclei are grouped in a peanut-shaped polygon: decrease the
Sigmavalue. It is because the sigma value is used as a parameter for the Gaussian filter applied to the image, and the details of your image are destroyed. - If there are big aggregates you can't get rid of: decrease the
Maximum areatolerated for nuclei. It will remove the whole group.
B. Run for the project
- If you are satisfied with the result, you can run the cells detection for the whole project.
- Go in the "Workflow" tab and convert your commands history into a script.
- The script should contain a ton of attempts for the cells detection and the testing annotation removal.
- Delete every run of the cell detection except for the very last one (containing your last set of parameters).
- Add the instruction to create a full image annotation as we did in other exercises. If you need, you can help yourself of the
 QuPath's API.
 - Remove everything else, and that's all! Your script should contain only two lines:
createFullImageAnnotation(true)
runPlugin('qupath.imagej.detect.cells.WatershedCellDetection', '{"detectionImage":"Channel 3","requestedPixelSizeMicrons":0.6535,"backgroundRadiusMicrons":5.0,"backgroundByReconstruction":true,"medianRadiusMicrons":0.0,"sigmaMicrons":0.5,"minAreaMicrons":10.0,"maxAreaMicrons":400.0,"threshold":300.0,"watershedPostProcess":true,"cellExpansionMicrons":5.0,"includeNuclei":true,"smoothBoundaries":true,"makeMeasurements":true}')
- You can now use the
 "more options" button to run the script for the whole project.
 - Once the run is done, don't forget to save your project.
C. Export the measurements and process the ratios
- Once you saved, you can go to "Measurements" > "Export measurements...".
- Transfer to the right column all the images onto which you ran the detection.
- We defined in our goals that we want to process the ratio per cell and then process the mean ratio, so we need per-cell information. Given that requirement, we can set the "export type" to "Cells".
- After you chose an output path, you can export your TSV.
D. In LibreOffice Calc
- If you open the TSV, you should have one line per cell.
- The channel of interest is the first one, so we can remove useless columns to keep only:
- Image
- Nucleus: Channel 1 mean
- Cytoplasm: Channel 1 mean
- Create a new column on the right of the "Image" column, and give it the title "Nucleus-to-cyto".
- Write the expression to process the ratio and apply it to the whole column.
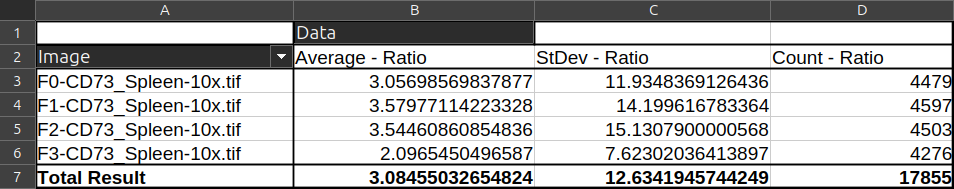
- Select the "Image" and "Nucleus-to-cyto" columns and go to: "Data" > "Pivot table" > "Insert or Edit..." and launch it on the current selection.
- In "row fields", drag and drop the "Image" column.
- In the "data fields", drag and drop the "Nucleus-to-cyto" column a first time and set it to "Average". Then bring it a second time and set it to "StdDev". Optionally, bring it a third time and set it to "Count" to know how many cells were in the image.
5.1.2 Count nuclei in mouse spleen
On an image with a clean staining, we can very quickly get a decent result with the basic QuPath built-in method, but what about a case with a more diffuse staining?
Goals:
- Following the same steps as in Ex 5.1.1 Mean nucleus-to-cytoplasm CD73 intensity, try to segment the nuclei in images of mouse spleen.
- We just want to count them, so you don't have to make any intensity measurement in them.
Required data:
| Folder | Description | Location | License |
|---|---|---|---|
| NuInsSeg | H&E images of mouse spleen | Kaggle: NuInsSeg | CC-BY-4.0 |
Tip
A good color deconvolution represents 90% of the work here, take your time to make it as good as you possibly can.
A. Principle
a. Tune the settings
- Start by doing a good color deconvolution. You don't have background in these images (or very few), so you will have to do the small rectangles method.
- Launch the cell detection window ("Analyze" > "Cell detection" > "Cell detection...")
- We have a H&E image here, so set the detection channel to "OD Hematoxymin" that you created yourself by doing the color deconvolution.
- Switch the cell expansion to 0µm, we just want to segment nuclei, not estimate the cytoplasm.
- Using the steps that we saw before, try to segment the nuclei the best that you can.
- If you are having a hard time finding parameters, you can start from these:
| Parameter | Value |
|---|---|
| Requested pixel size | 0.325 µm |
| Background radius | 5 µm |
| Use opening by reconstruction | No |
| Median filter radius | 0 µm |
| Sigma | 2.0 µm |
| Minimum area | 20 µm² |
| Maximum area | 120 µm² |
| Threshold | 0.35 |
| Cell expansion | 0 µm |
b. Segment nuclei for the project
- Don't forget to remove the annotation containing your testing run before starting this step!!
- Here, you are not in fluo, we used a color deconvolution. When you will remove all the useless lines of your script, don't remove the last line of color deconvolution (last attempt).
- Re-create the script that we made in 5.1.1 with one line being the creation of a full image annotation and the other being the call to the cell detector (and the one for color deconvolution before them).
- We will reuse this project for other purposes, so to keep things clean, we would like to know where each object comes from.
- To do so, we will use the
 recursive_set_class.groovy script. Simply open it and copy and paste it at the end of your script.
 - The
given_classvariable indicates what class will be given to all the child objects belonging to the current annotation (including the annotation itself). - Here, we are using QuPath's built-in method, so we will set:
given_class = "BuiltIn". - You can launch the execution on the project.
Note
Save this project and keep it clean, we will reuse it in the next exercise. The last step with the BuiltIn is only forquality control later, it is not part of the usual workflow.