 |
 |
|---|---|
| • | Ex 6.2: Use a N-classes object classifier |
6. Cells classification
6.1 Threshold-based cells classification
So far, we attributed classes only to annotations, but detections can also be classified using various parameters. These parameters are stored as key-value pairs within each individual detection. The most basic way to classify a cell is by using a threshold over the values corresponding to a given key (ex: mean intensity, area, ...)
6.1.1 Classify nuclei in kidney biopsies
Goals:
- We want to count how many DAB+ nuclei are present in the kidney biopsies onto which we previously segmented nuclei in Ex: 5.5.1 Count nuclei in kidney biopsies.
- We will introduce little specificities:
- we only want to take into account nuclei farther than 50µm from the borders.
- we don't want the nuclei from the glomeruli
- To do so, we will:
- process new measurements for each cell.
- visualize on the objects the different values that we can use for classification.
- create a threshold-based object classifier.
- apply the classification to the whole project.
- export the measurements.
Required data:
| Folder | Description | Location | License |
|---|---|---|---|
| Histology (PAS-HE-IHC) | H-DAB images of kidneys into which glomerulus are visible and lungs into which alveolus are present | DOI: 10.1038/s41467-023-40291-0 | MIT |
Note
Before starting, place yourself on an image where you have obvious DAB+ and DAB- nuclei.
A. Process a new measurement for nuclei
a. Process the signed distance
- If you double-click on a nucleus in the viewer and make it active (yellow in the viewer), you can see its associated key-value pairs in the lower-left corner of QuPath (in the "Annotations" tab).
- In there, thanks to the fact that we used
makeMeasurements(true)in InstanSeg's settings, you should find entries such as the area, the circularity, the mean of DAB, ... - If you navigate in there, you will notice that there is nothing here that will help us to remove elements that are closer from the border than we want.
- QuPath allows you to process new features for each detection, you will find that in the "Analyze" menu from the tob-bar.
- In "Calculate features", you will have the possibility to process shape and intensities features. That doesn't interest us, we already processed them through InstanSeg.
- In "Spatial analysis", however, we will find metrics about the spatial relations between detections.
- We want to measure the distance between each individual nucleus and the
Kidneyannotation so, to get started, you should make theKidneyannotation active. To do so, right-click on theKidneyclass in the class list and use the "Select objects by classification" tool. - Then, you can go to "Analyze" > "Spatial analysis" > "Signed distance to annotation 2D...".
- When you are asked whether you want to split multi-part classifications, answer whatever you want, we don't have such classifications.
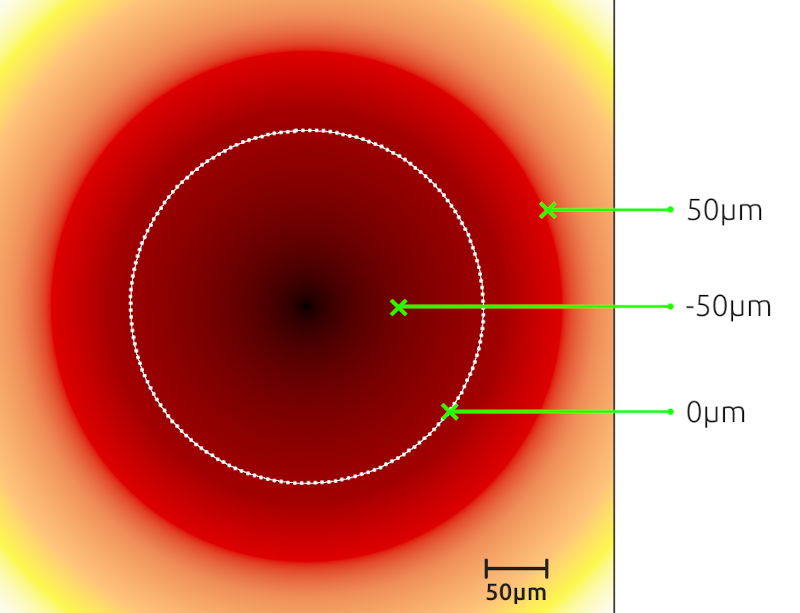
- The signed distance to the annotation is simply the shortest distance to travel to reach the annotation that we pass in negative if we are inside the annotation and positive if we are outside the annotation.
- Once you did that, you can double-click on a nucleus again and in its measurements list, you should have a "Signed distance to annotation Kidney µm" entry.
b. Visualize a measurement
- We just processed a new measurement but what we are about to cover could have been used from the begining to inspect measurements that we already had.
- We want to have a visual feedback of the way our measurements are distributed in the image.
- You can go to "Measure" > "Show measurement maps".
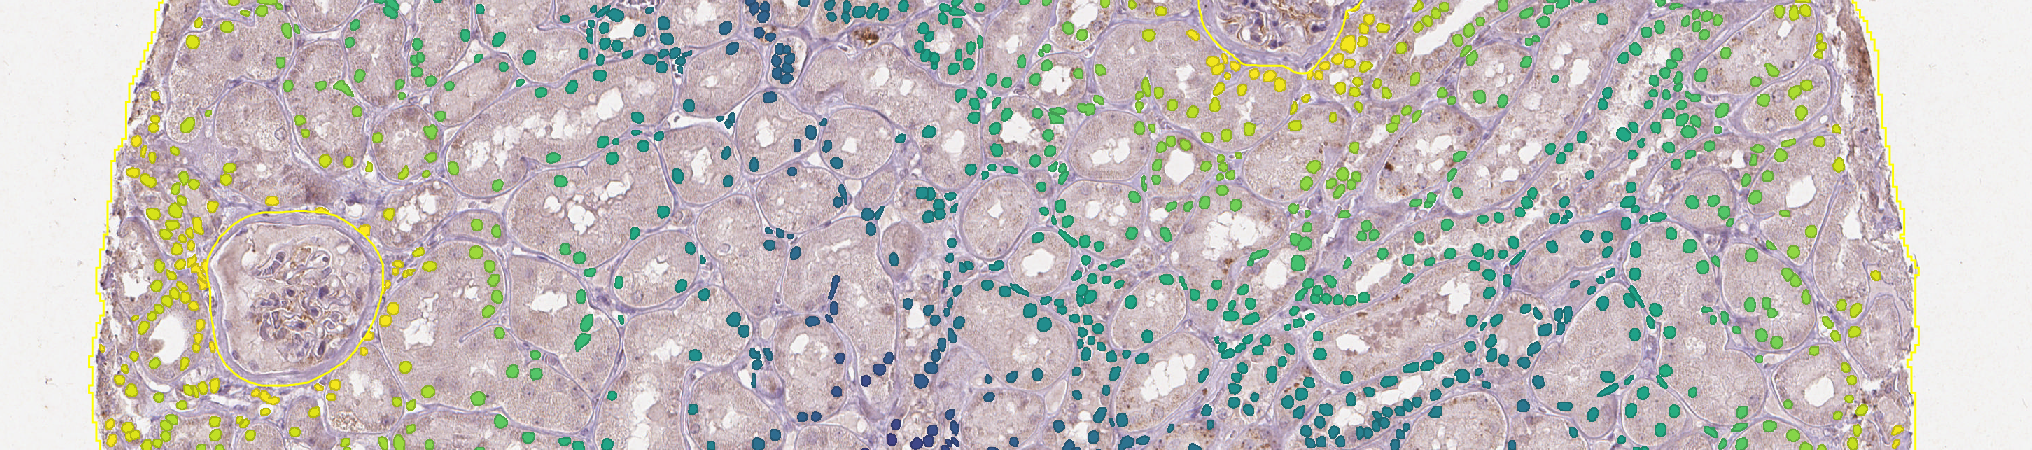
- In the list that shows up, you can click on the signed distance that we just processed (or any measurement you like, this is just for visualization purpose). It should change the color of nuclei in the viewer depending on the value they own for this measurement.
- To have a clearer view, you can
 activate the filling of detections.
B. Remove objects closer than 50µm from the border
a. Create a threshold-based object classifier
- To this point, we need a way to discriminate the nuclei based on their distance to the
Kidneyannotation. - To do that, we will create an object classifier that will give the class
Region*to the nuclei that are too close from the annotation and left the others untouched. - Start by closing the measurement maps window if you still have it open, and go to "Classify" > "Object classification" > "Create single measurement classifier...".
- In the "Measurement" field, indicate that we want to classify based on the signed distance that we processed.
- If you take a look to the signed distance figure again, you will notice that:
- Objects inside the annotation have a strictly negative value.
- The farther you get from the annotation, the lower the value.
- Based on that, we will set the "Above threshod" class to
Region*(what we want to discard) and the "Below threshold" toUnclassifiedto let other nuclei untouched. - Once you did it, you can set the threshold value to -50 and activate the live preview to check that everything is as you expect.
- If everything looks alright, you can give a name to your classifier, save it and close the settings window.
b. Remove the classified nuclei
- To remove the target nuclei, we need to apply the classifier and to remove nuclei having the
Region*class. - You can apply the classifier by going to "Classify" > "Object classification" > "Load object classifier...". In the list, choose the classifier that we just made and apply it.
- Once it is done, you can close the "Load classifier" window.
- The last step is to remove
Region*objects. - To do so, right-click on the
Region*class in the class list and use the "Select objects by classification" feature. - Right after doing that, click on the "Delete" button below the annotations list.
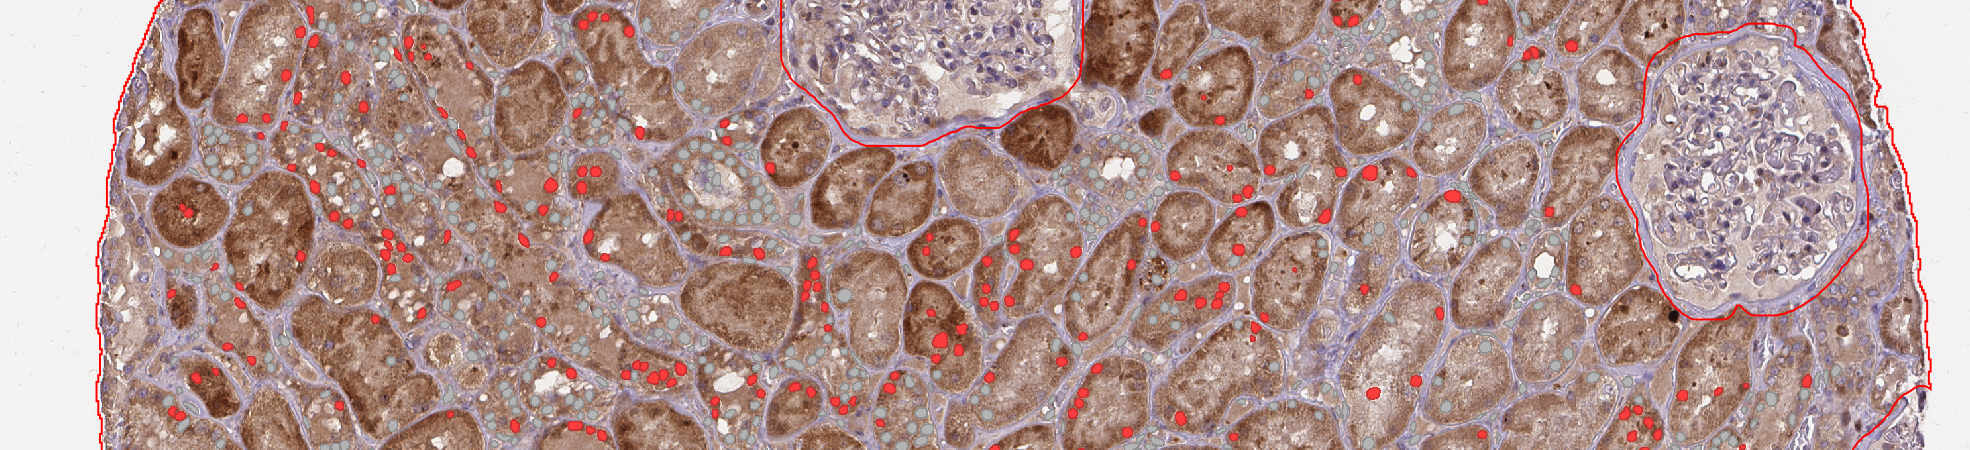
C. Count DAB+ nuclei
- Optionally, before starting, you can reopen the measurement maps and inspect the "DAB mean" measurement. Using it, you can start trying to figure out the threshold value to be used for a nucleus to become DAB+. Before going to the next step, you need to close the measurement maps again because the LUT display colides with the classification preview.
- Go back to "Classify" > "Object classification" > "Create single measurement classifier...".
- Set the "Channel filter" to "DAB", it will hide everything unrelated to DAB in the "Measurement" dropdown menu.
- In the "Measurement" list, choose "DAB mean".
- Set the "Above threshold" class to
Positiveand the "Below threshold" one toIgnore*.
Tip
You can display the DAB channel by itself using the ![]() "channels tool". It could be easier to distinguish positive cells this way.
"channels tool". It could be easier to distinguish positive cells this way.
- You can now activate the "live preview" and adjust the threshold value to keep only the DAB+ nuclei.
- Once you are happy with what you see, give a new name to your classifier, save it and close the settings window.
- You can apply the classifier by going to "Classify" > "Object classification" > "Load object classifier...". In the list, choose the classifier that we just made and apply it.
- If you double-click on the
Kidneyannotation, you should see two new entries: "Num Ignore*" and "Num Positive".
D. Run for the project
- As usual, go to the "Workflow" tab and turn your commands history into a script.
- If we summarize the steps to reproduce to get to this result:
- We selected our kidney annotation.
- We processed the signed distance from each nucleus to it.
- We classified out nuclei according to their distance to the kidney.
- We selected every object having the
Region*class. - We removed them.
- And we classified the left over nuclei to the DAB.
- Find the lines corresponding to these steps and delete everything else.
- You should be left with a script similar to this:
selectObjectsByClassification("Kidney");
detectionToAnnotationDistancesSigned(false)
runObjectClassifier("too-close")
selectObjectsByClassification("Region*");
removeSelectedObjects()
runObjectClassifier("find-dab")
- You can run this script for the whole project, except for the image on which you have worked so far.
- Once the run is over, don't forget to save your project.
- If you go to "Measure" > "Export measurements" you could have:
- The number of positive nuclei per kidney (per image) if you set the export type to annotation.
- The detailed version of each value for each nucleus per image you you go with detections.