7. Multiplex Analysis
In multiplex analysis we have one staining for the nuclei and a number of stainings $C_1, C_2, ..., C_n$ that are markers of interest. We want to count the number of cells that are positive for each marker $C_i$ and for all the possible combinations
$$ \begin{pmatrix} C_1-C_2, \\ C_2-C_3, \\ C_1-C_3, \\ C_1-C_2-C_3, \\ ... \\ \end{pmatrix} $$
The steps for a multiplex analysis are:
- Set the channel names and colors. These are more important than usual, since we will use the channel names as class names later. We will have a large number of classes since we have the cells positive for a single marker and for the combinations of markers. For two markers we obtain already 7 classes. We might therefore want to choose the colors carefully.
- Detect all cells.
- Train a classifier for each stain.
- Create a combined classifier.
- Apply the combined classifier to the project
- Export the measurements
- Reorganize the output data to get the total number of positive detections for a marker whether single or in combination.
7.1 Setting channel names and colors
For one image the channel names and colors can be set via Brightness and Contrast tool.
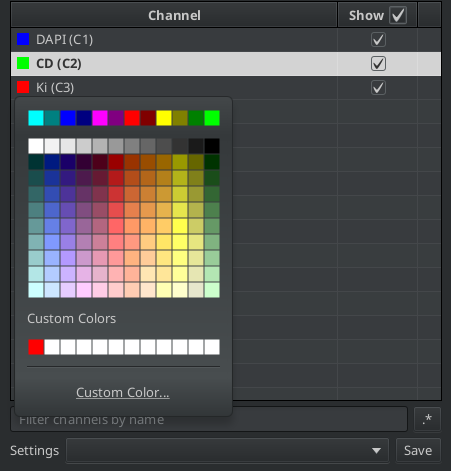
Fig. 7.1 – The channel names and colors can be set from the B&C-tool.
When you hoover over a color its RGB-components are displayed in the form of a hex-code. We will need the RGB-components when we set the colors in a script. The hex-code starts with the sign # and is followed by 3 hexadezimal numbers, each with two digits that can take the values between 0 and 15. The digits 10 to 15 are represented by the letters A to F. To convert the hexadezimal number to a dewimal number you multipy the lower (right) digit by 1 and the the higher digit (left) by 16 and add the two values.
For examle:
$$ FF = 15 * 16 + 15 * 1 = 255 \\ 9A = 09 * 16 + 10 * 1 = 161 $$
That means for the hexcodes:
#FF0000 = 255 red,   0 green,  0 blue
#00FF00 =   0 red, 255 green,  0 blue
#0000FF =   0 red, 255 green,  0 blue
#90AA3E = 144 red, 170 green, 62 blue
To set the channel names and colors on all images of the project, download the script set_channel_names.groovy and save it into the script folder of the project. You can then open it from the menu Automate>Project scripts>set channel names. Run it on all images of the project. A dialog will be opened and you have to enter the channel names on the left side and the hexstrings of the colors on the right side.
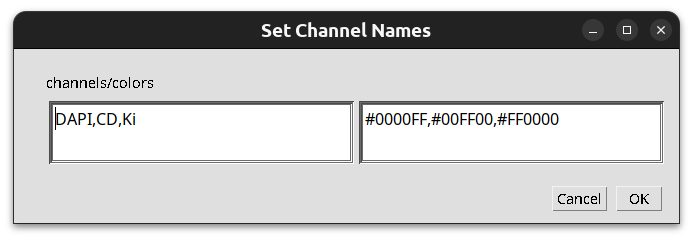
Fig. 7.2 – The dialog of the script to set the channel names and colors.
7.2 Cell Detection
You can apply one of the methods you know for the cell detection. Script 7.1 shows a script using QuPath's watershed cell detection. Run the cell detection on all images in the project.
setImageType('FLUORESCENCE')
removeAllObjects()
createFullImageAnnotation(true)
runPlugin('qupath.imagej.detect.cells.WatershedCellDetection',
          '{"detectionImage":"DAPI",' +
          '"requestedPixelSizeMicrons":0.5,' +
          '"backgroundRadiusMicrons":8.0,' +
          '"backgroundByReconstruction":true,' +
          '"medianRadiusMicrons":0.0,' +
          '"sigmaMicrons":1.5,' +
          '"minAreaMicrons":10.0,' +
          '"maxAreaMicrons":400.0,' +
          '"threshold":100.0,' +
          '"watershedPostProcess":true,'+
          '"cellExpansionMicrons":5.0,' +
          '"includeNuclei":true,' +
          '"smoothBoundaries":true,' +
          '"makeMeasurements":true}')
The cell detection automatically adds shape and intensity measurements for the cell and the nucleus and intensity measurements for the cytoplasm.
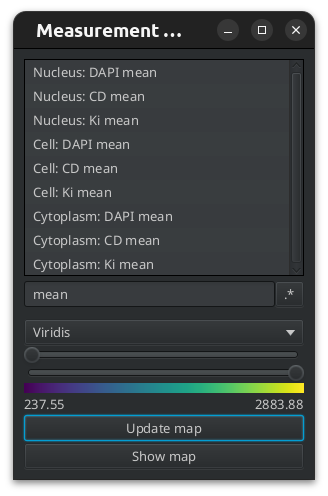
Fig. 7.3 – The cell detection has added measurements as can be seen on the measurement maps tool.
7.3 Trainig a classifier for each channel
We will now train an object classifier for each channel. We first need to create classes that corresponds to the channels. QuPath can do this automatically with the command Populate from image channels, that you find from the menu at the top of the class list.
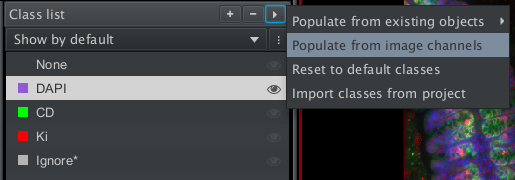
Fig. 7.4 – The command
populate from image channels creates a class for each image channel
Note
Classes are created for the project, not for a specific image. Therefore it is enough to create the classes once.
Train an object classifier for each of the markers independently. Use the class named after the marker for the positive cells for that marker and the class Ignore* for the negative cells each time.
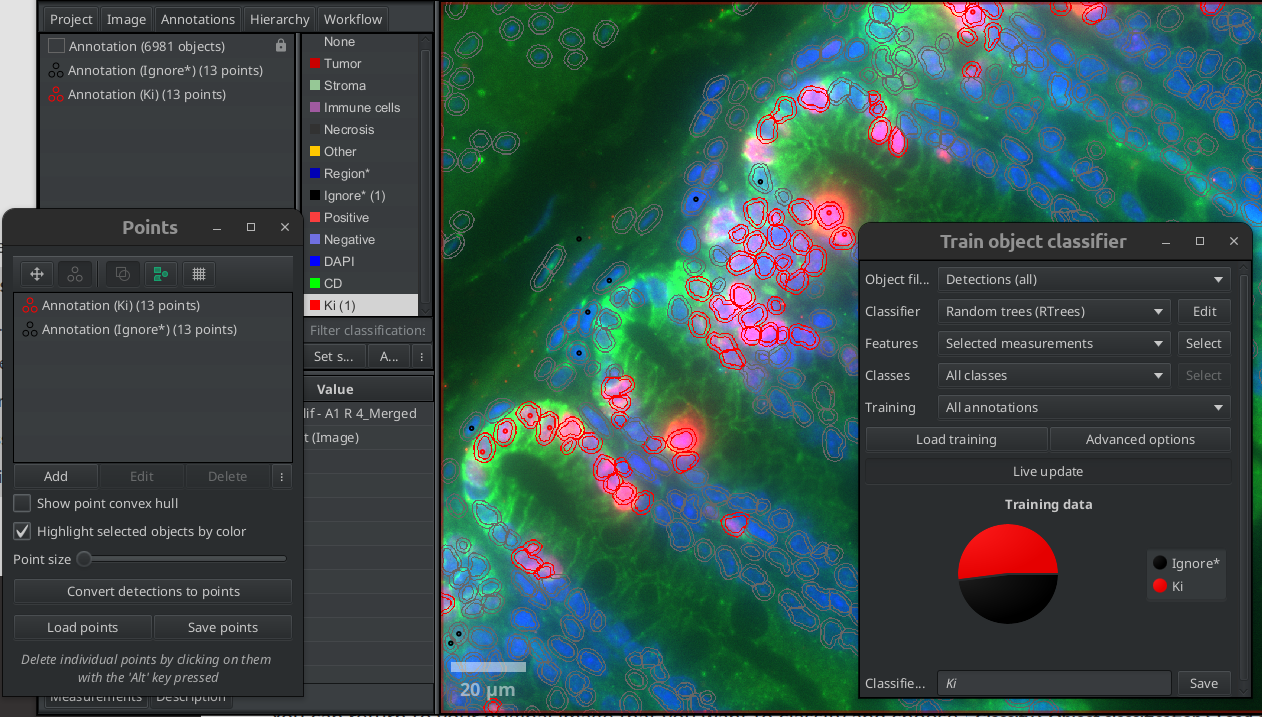
Fig. 7.5 – Train a classifier for each marker.
For the classifier for a given marker, you should mainly select features based on the corresponding channel. You can use the Selected measurements option and manually select the features, or you can select the filtered by output class options. In the second case the measurements that have the output class name in their name will be selected. You need to make sure in that case, that the name of one class is not part of the name of another.
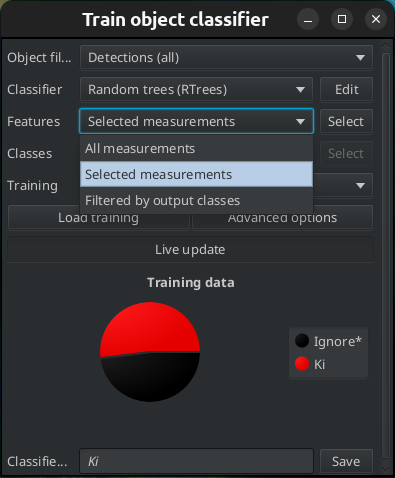
Fig. 7.6 – Selecting measurements.
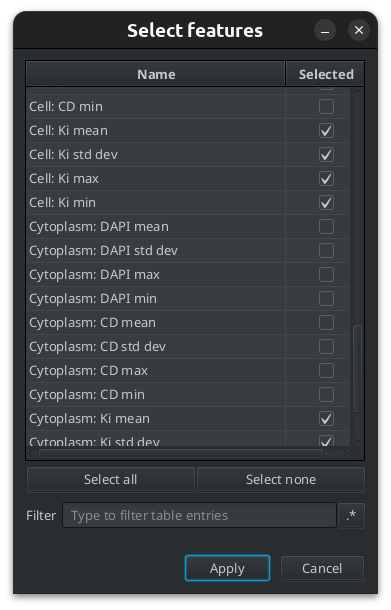
Fig. 7.7 – Manually selecting measurements.
7.4 Creating a composite classifier
To create a composite classifier run the command Create composite classifier from the menu Classify> Object Classification. Move the single classifiers that you want to be part of the composite classifier from the list on the left side to the list on the right side. Name the composite classifier and save it.
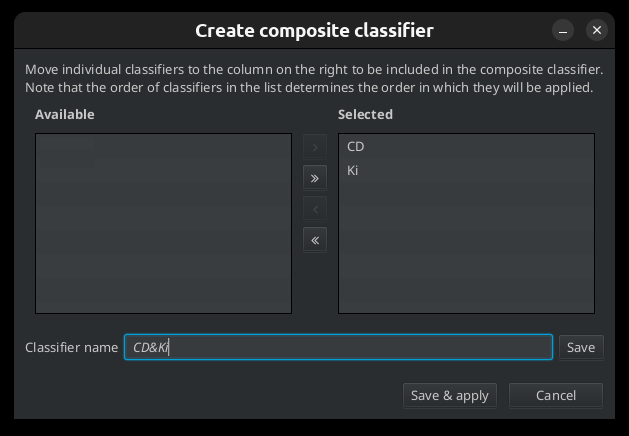
Fig. 7.8 – Creating a composite classifier.
7.5 Viewing classifications
You can load and apply the composite classifier like any other object classifier via the menu Classify>Object classification>Load object classifier. Depending on the colors, the classes that are positive for multiple markers might be difficult to see. You need to add the classes to the class list, then you will be able to change their color. The easiest way to do this is to use Populate from existing objects>all classes from the more options menu at the top of the class list
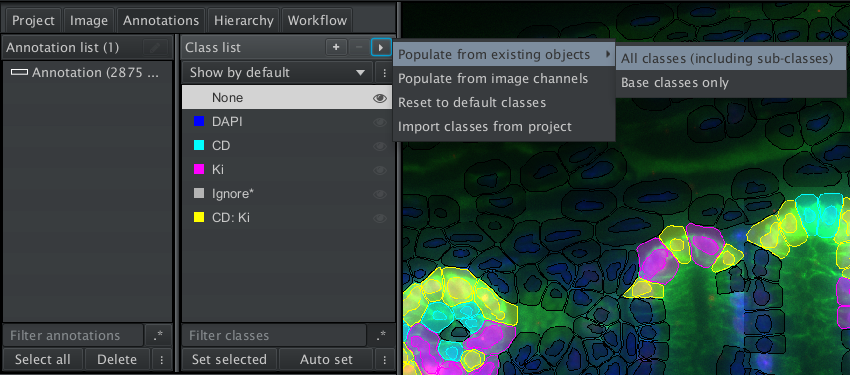
Fig. 7.9 – Add the classes for marker combinations to the class list.
Tip
If you want to change the default color for the detections that do not belong to a class, you can do so from the menu Edit>Preferences. Under Object select a new color as Default object color.
7.6 Running the composite classifier on the project
Applying the composite classifier to the project in a script is the same as applying any classifier. If you apply the composite classifier to one image you will find the command runObjectClassifier with the name of the composite classifier in the recorded script:
setImageType('FLUORESCENCE')
removeAllObjects()
createFullImageAnnotation(true)
runPlugin('qupath.imagej.detect.cells.WatershedCellDetection',
          '{"detectionImage":"DAPI",' +
          '"requestedPixelSizeMicrons":0.5,' +
          '"backgroundRadiusMicrons":8.0,' +
          '"backgroundByReconstruction":true,' +
          '"medianRadiusMicrons":0.0,' +
          '"sigmaMicrons":1.5,' +
          '"minAreaMicrons":10.0,' +
          '"maxAreaMicrons":400.0,' +
          '"threshold":100.0,' +
          '"watershedPostProcess":true,' +
          '"cellExpansionMicrons":5.0,' +
          '"includeNuclei":true,"smoothBoundaries":true,"makeMeasurements":true}')
runObjectClassifier("CD-KI")
After you ran the script for the project, you will find the number of objects in the different classes in the measurements.
7.7 Measurements and total count of positive cells for a marker
When exporting the measurements you will find the single and combined marker classes in the measurements for the image, for the annotations and for the detections. If we are interested in the numbers for the project, we can look at the image measurements
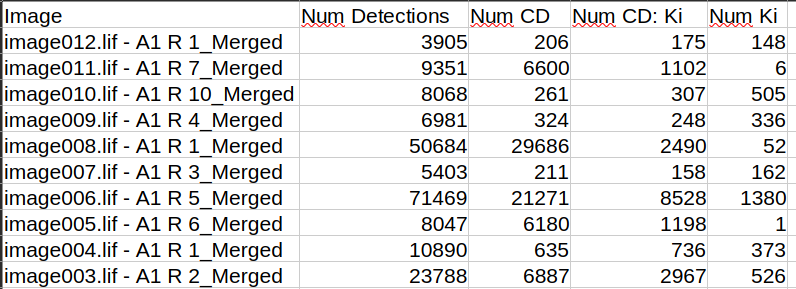
Fig. 7.10 – Numbers of cells positive for single and multiple markers.
Note
The numbers of the single and combined classes are mutually exclusive, i.e. the count in the class for a single marker includes only the cells that are only positive for this marker and for none of the other markers. If you want to have the total number of positive cells for a marker including those that are also positive for other markers, you have to add the entries in your spreadsheet. Alternatively you can run the script convert_table.groovy to add columns with the total numbers for each marker. In oder to run the script, you should first save it as well as the file CombinationClassCounter.groovy into the folder scripts of your QuPath project.