Machine Learning for
Bio-Image-Analysis

10.05.2021
Volker Bäcker, Jean-Bernard Fiche,
Cedric Hassen Khodja, Francesco Pedaci
Introduction

What is bio-image analysis?
How is it done without machine
learning?What is machine learning?
How is bio-image analysis done
with machine learning?
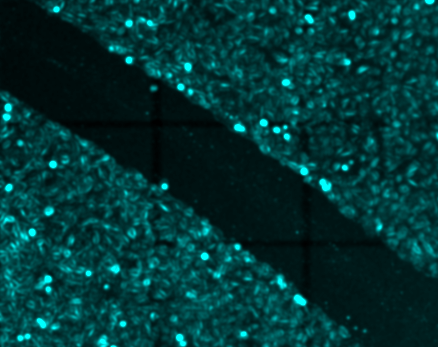
Bio-Image-Analysis
“The extraction of information from digital images in the context of biological research”
The Image-Analysis Workflow
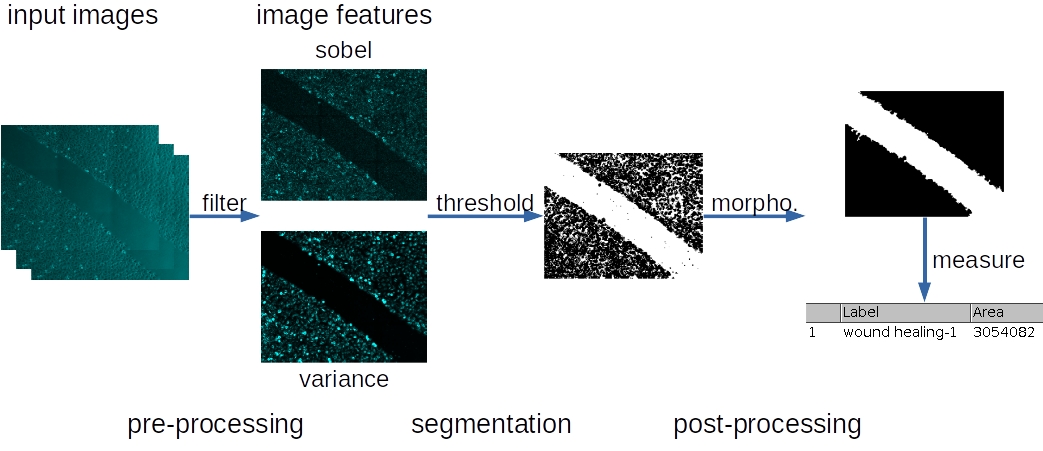
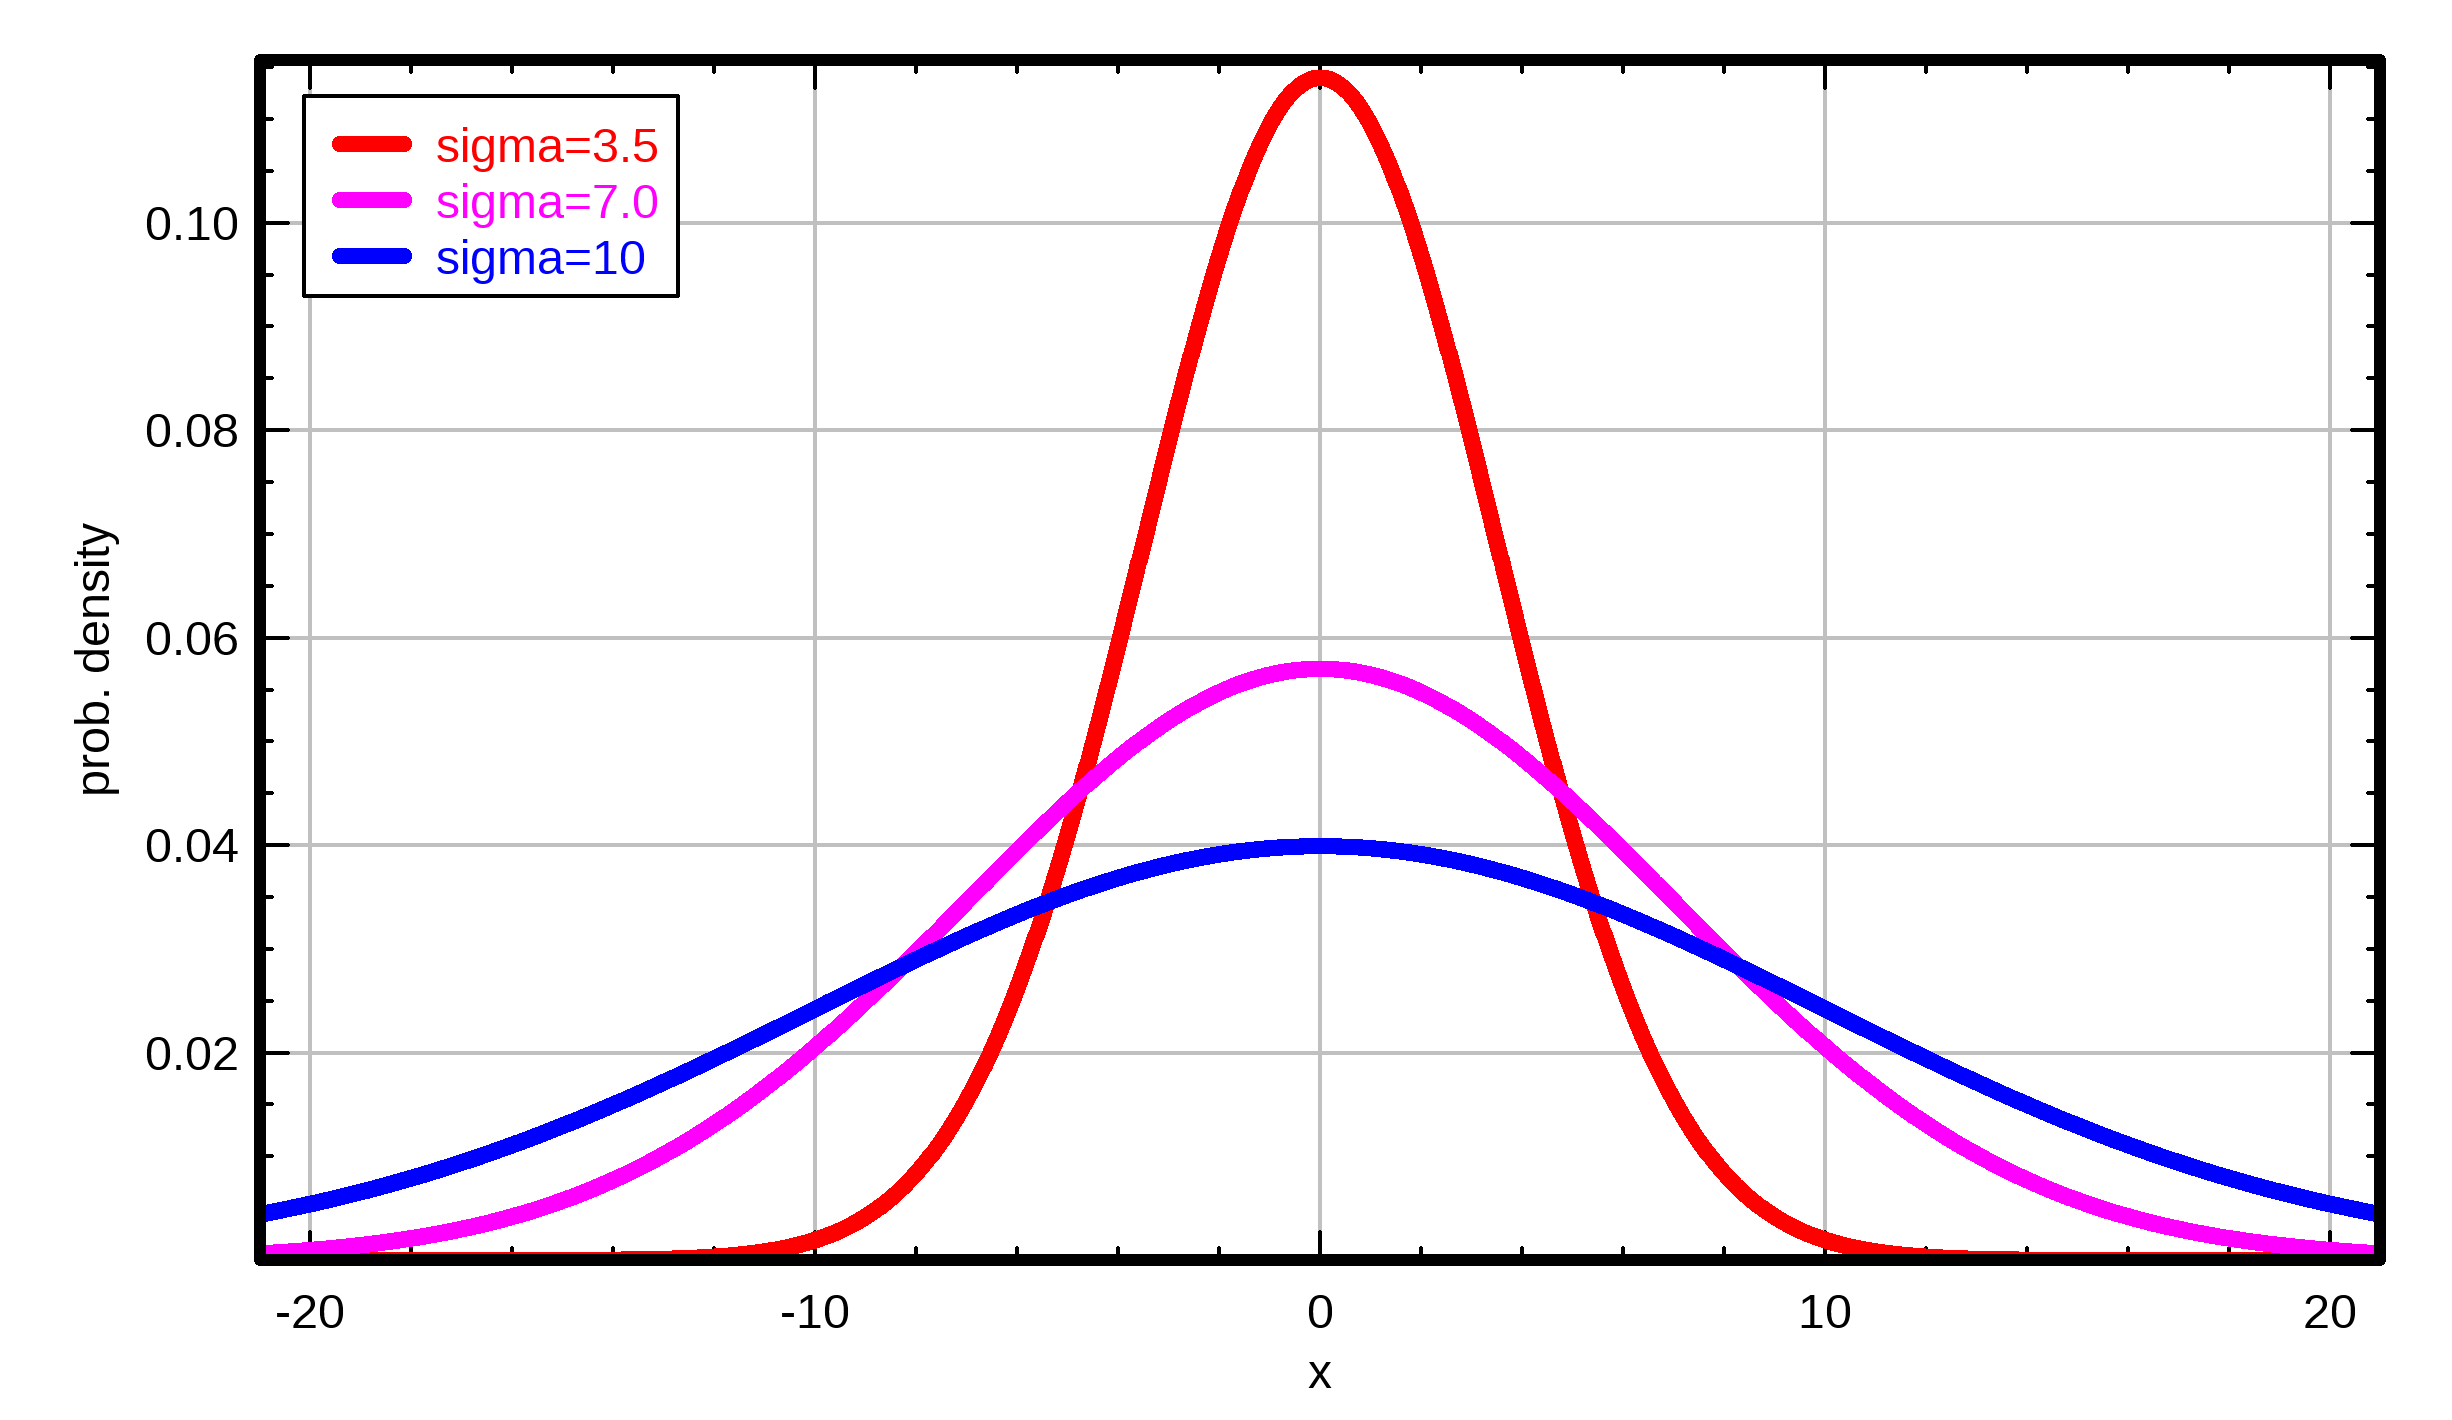
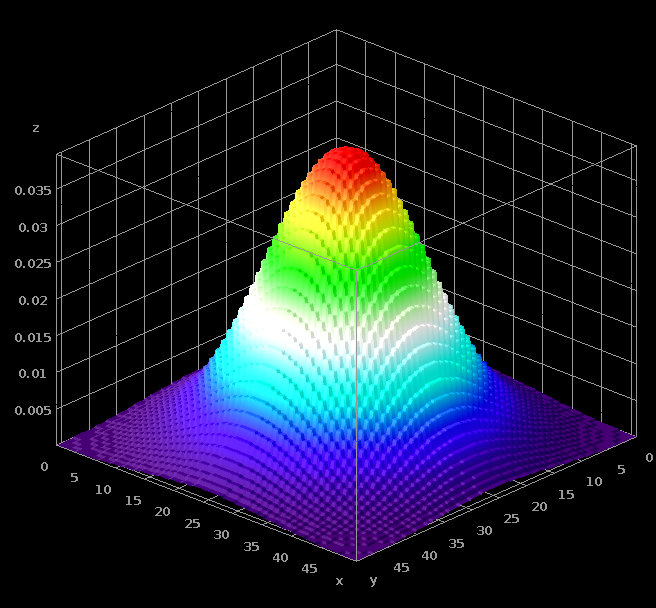
Select a scale
- Use “Gaussian blur”-filter to select a scale
- Low-pass filter
- Removes high frequencies from the image
- The higher sigma, the lower the remaining frequencies
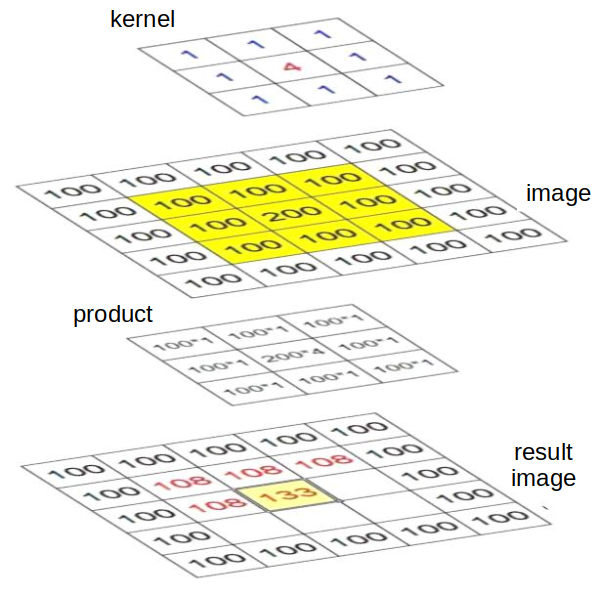
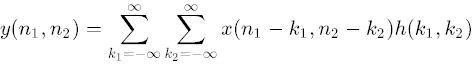
Convolution

Features at different scales
| feature | σ=3.5 | σ=7.0 | σ=10. |
|---|---|---|---|
| variance |
|
|
|
| sobel |
|

|
|
Machine Learning
Machine learning algorithms build a mathematical model of sample data, known as ”training data”, in order to make predictions or decisions without being explicitly programmed to perform the task.
Machine Learning phases
- training
- a model is learned from training data

- validation
- the trained model is validated
against test data
- the trained model is validated
- application
- use the trained model to
make predictions on new data
- use the trained model to
Machine Learning vocabulary

|
|

|
|

|
|
|
|
Machine Learning -
How is that even possible?
ML algorithm implements a
mathematical model with a number
of model parametersgiven the training data,
find parameter values that minimize
the prediction error
Machine Learning Example 1
Linear Regression
Training Data:
| Femur length (cm) | Height (cm) |
|---|---|
| 45 | 153 |
| 44 | 168 |
| 44 | 177 |
| 47 | 180 |
| 44 | 171 |
| 50 | 168 |
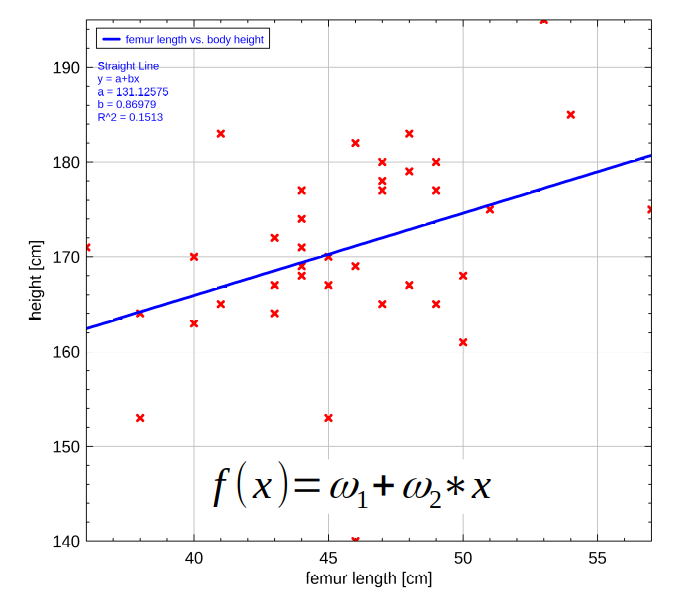
estimate body height f(x) given the femur length x.
model: f(x) = ω1 + ω2 × x
parameter of the model:
ω1 and ω2
Machine Learning Example 1
Linear Regression
find parameters
ω1, ω2so that error
between
training data
and model
is minimal
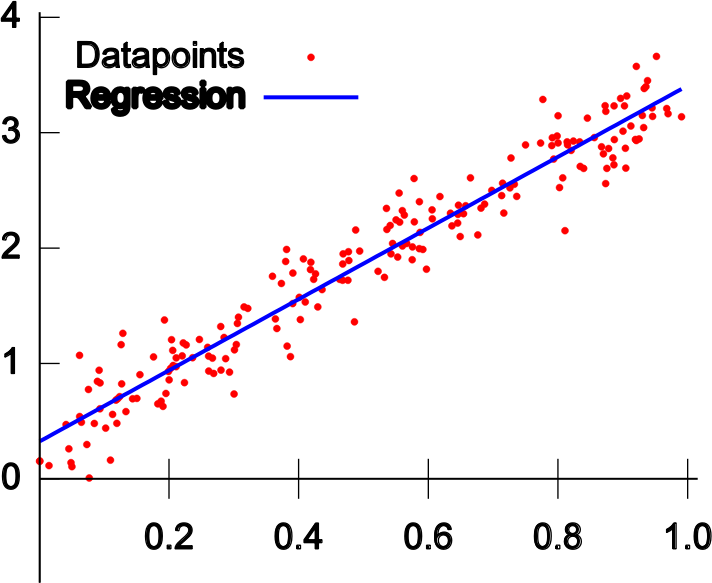
Example 1 - Squared Loss function
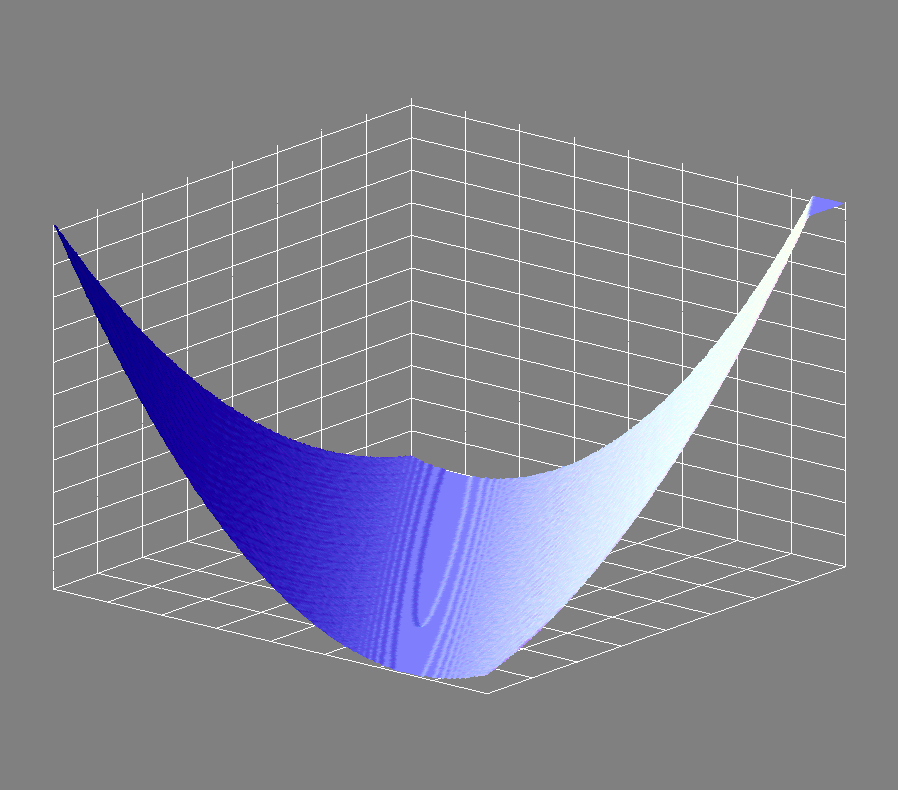


Example 1 - Gradient descent
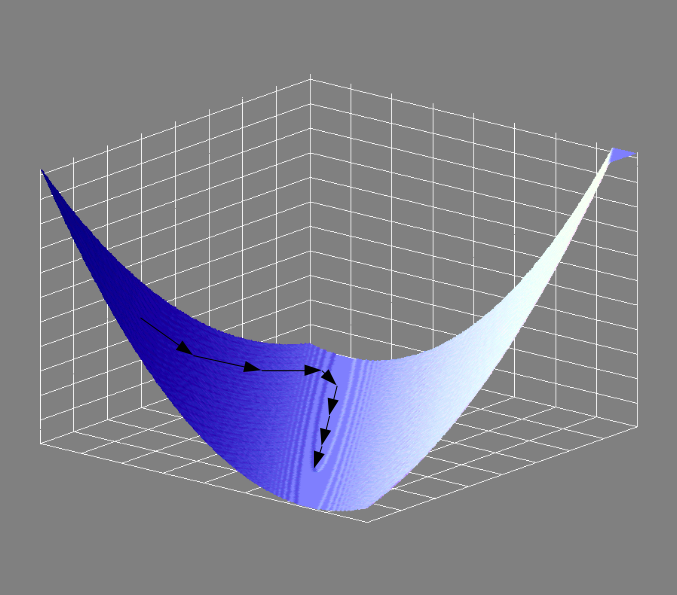
find the minimum of
the loss functionby using gradient
descent
Example 1 - Predictions
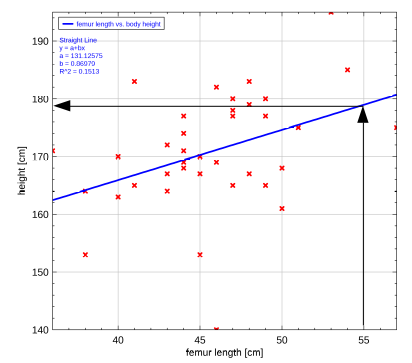
f(x) = ω1 + ω2 × x
ω1 = 131.13cm
ω2 = 0.87
f(55cm) = 131.13cm + 0.87 × 55cm
f(55cm) = 179.42cm
The programs

- ImageJ/FIJI

- Weka / Labkit

- Ilastik

- Cellprofiler / CP Analyst

- Orbit
Clustering
A machine learning method
Unsupervised
Classification
Clustering
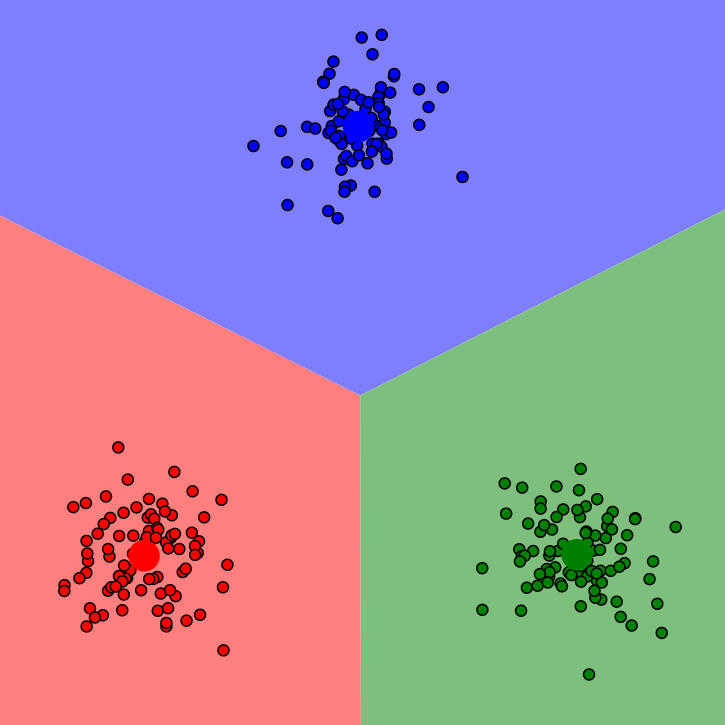
Clustering
Group objects in a way that
objects in the same cluster are
more similar to each otherthan to objects in other clusters
k-means clustering
- Algorithm:
- Start with k initial means
- Repeat until convergence
- Assign feature-vectors to clusters
- Recalculate the means of the clusters
Partition the feature-
space into k-clustersEach feature-vector
belongs to the cluster
with nearest meanK-means example
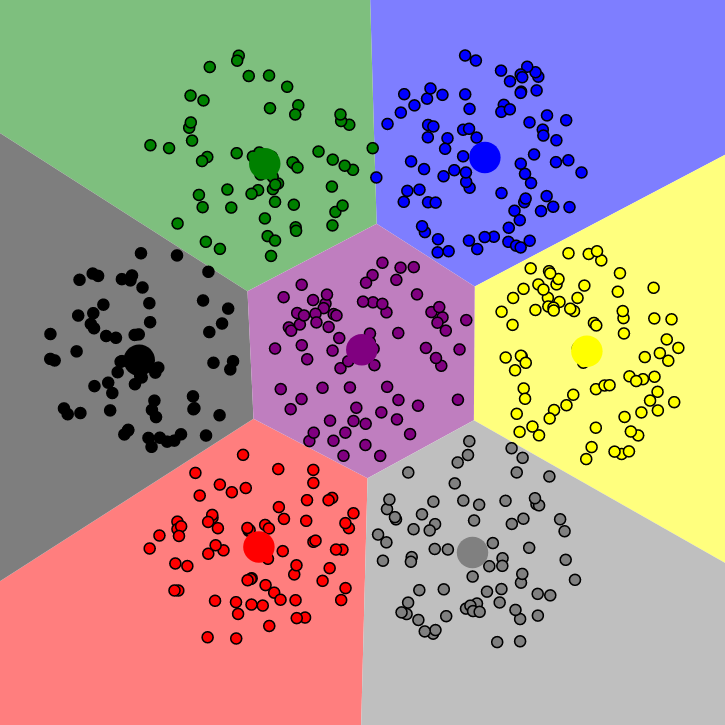
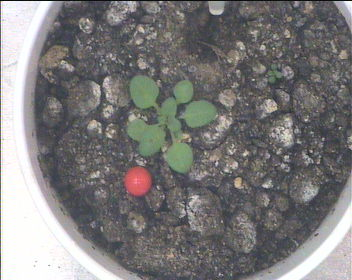
Classify pixels by color
- RGB
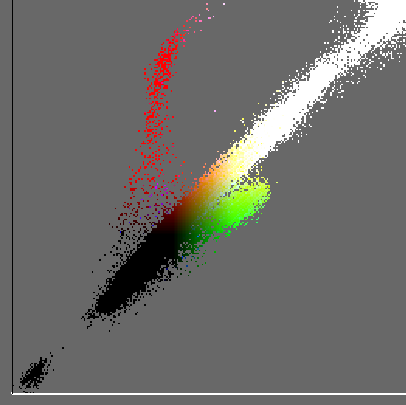
- input image
CIEL*a*b* color-space
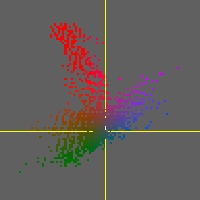
- CIELab* color-space
- L = lightness
- a = green (-) to red (+)
- b = yellow (-) to blue (+)
- Designed, so that
- distances correspond to perceived
distances between colors.
- distances correspond to perceived
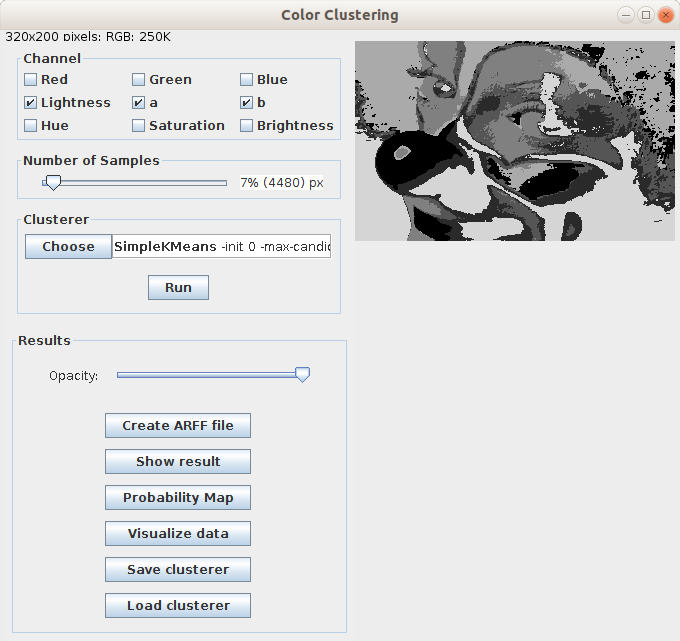
Software
- color clustering in FIJI
- comes with WEKA
- Plugins>Segmentation>Color Clustering